Turn "What If" into "What's Next".
Jenkins & Johnson Optimize gives board teams a way to model headcount, payroll, runway, and growth assumptions without turning every meeting into a spreadsheet fight.
Three minutes. One clean model.
Set a base plan, move the numbers that matter, and let the system recalc cash, runway, and variance while you stay in the meeting.
No waiting.
Use the current budget or start from scratch. The model keeps the base version visible the whole time.
Adjust headcount, salary changes, marketing spend, and revenue growth. The sliders are simple. The output is not.
AI calculates cash flow, variance, and runway on the spot. Then it shows the delta against your current plan so the board can see the trade-off in one view.
Done.
Why spreadsheets fail at scenario planning.
Version control breaks. Assumptions get buried. Board decks end up with screenshots that nobody trusts.
| Feature | Spreadsheets | Jenkins & Johnson Optimize |
|---|---|---|
| Version control | Weak - files drift fast. | Clear - one model, tracked changes. |
| Assumption audit | Manual - comments and guesses. | Clear - every driver is visible. |
| Board-ready output | Messy - screenshots and rework. | Ready - live dashboards and narrative summaries. |
| Collaboration | Slow - email chains and duplicates. | Fast - shared scenario views for the team. |
| Runway planning | Patchy - formula drift. | Direct - cash-out date updates instantly. |
One click, three views.
Use the same assumptions, then change the framing for finance, founders, or the board.
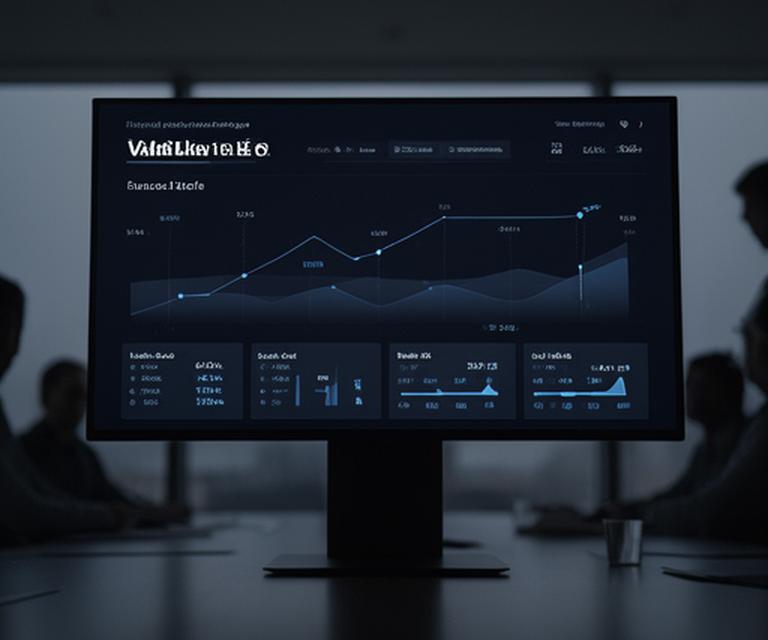
Shows the month cash goes negative, the reserve buffer, and the trigger points for hiring changes.
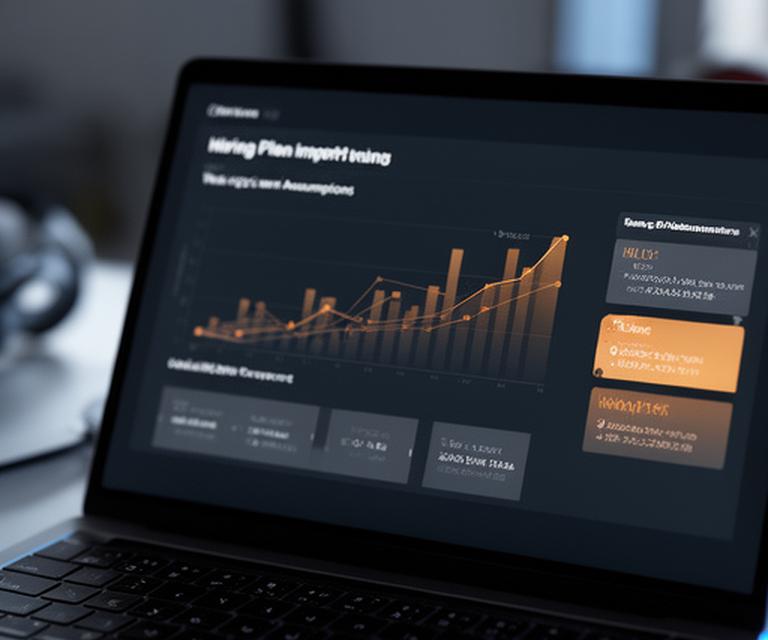
Compares new roles, payroll growth, and timing so leadership can see the burn step before it lands.
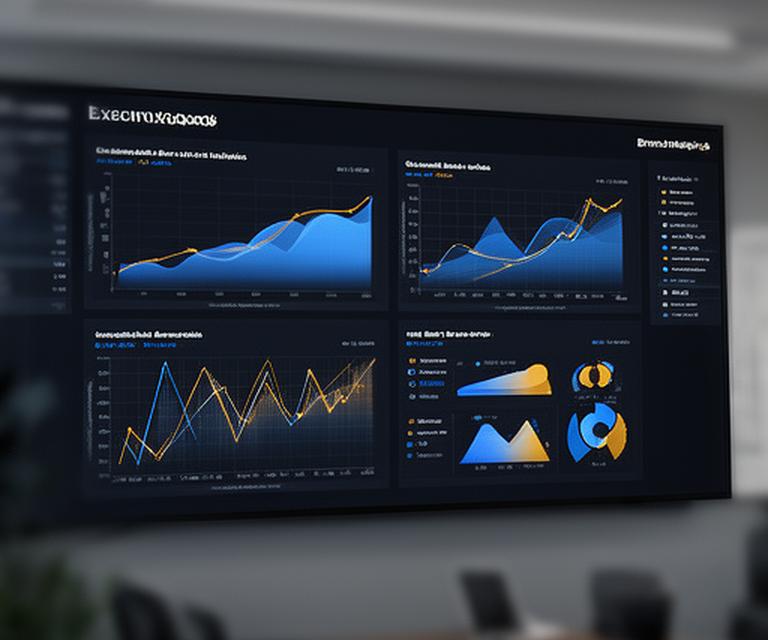
Pairs growth and spend in one chart, with a short narrative for the board note.
Built for how you decide.
Model a fundraise, a hiring pivot, or a pricing move without rebuilding the file each time.
That matters.
"Our board finally trusts the numbers because they can see the scenarios we've stress-tested."
The model shows its work. That is the point.
Start Scenario Planning
Talk through your current budget, your hiring plan, and the board questions you need to answer next.